Inkscape for Noobs – Part I: The Basics
What is Inkscape?
Inkscape is a graphics program which can be used to create vector graphics. It’s open source (i.e. everybody can look into the program’s code), it is licenced under a free licence, which allows everyone to change the program’s code, to use the program for any purpose and to share it with others, and it is constantly being improved by a community of committed volunteer developers. Many users also support Inkscape – for example by helping other users.
This means that, in contrast to many other computer programs, there is no company behind Inkscape, but a community of volunteers from all over the world, with an elected board committee and an umbrella organization (Software Freedom Conservancy), which creates a safe judicial context for the activities of the contributors (e.g. in order to make it possible that the project can accept donations).
Everyone who contributes to this project becomes part of the world-wide Inkscape community.
What is a Vector Graphic?
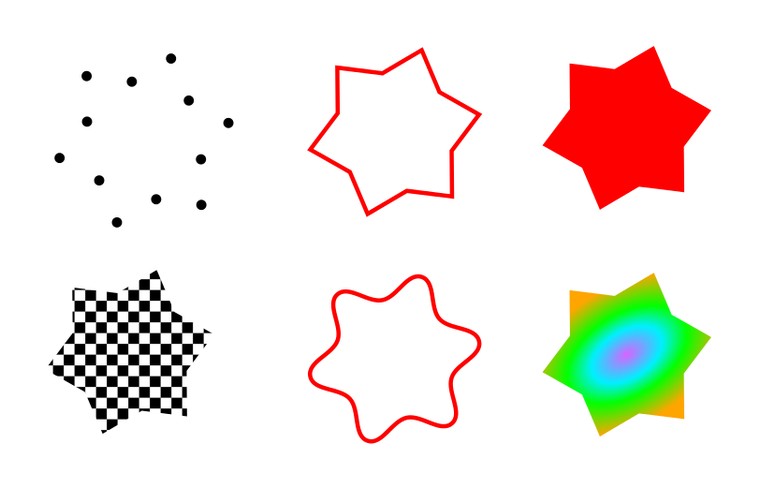
Vector graphics consist of separate objects. These are defined by their geometric properties, e.g. a circle by the position of its center and the size of its radius. For curved lines, specific properties are saved which describe the position of certain points on them and the curvature of the lines which connect these points to each other.
Objects in a vector graphic all have a well-defined set of attributes, each of which can easily be modified. This allows you to change the color of the fill or the contour line with a single click to some completely different color, to remove it or even to replace it by a pattern.
Examples of these attributes are: fill color, fill pattern, fill with a color gradient, color of the contour (stroke), width of the contour, contour pattern, type of contour line (e.g. dashed, dotted, …) or the type of markers (e.g. arrows or other symbols) used in the course of the path.
A Comparison: Vector Graphic vs. Raster Graphic
Always Crisp

A vector graphic behaves very differently from, for example, a photo, that was taken with a digital camera. Digital photos are raster graphics, and thus consist of a large number of colored dots, which are arranged in a specific order (the raster). When the distance of the viewer from the picture is large enough, all those little dots together form an image. But as soon as the photo is enlarged a little too much, all those single dots become visible – the image appears ‘pixelated’.
Because vector graphics are saved as instructions for the geometrical construction of the objects they contain (just like a set of geometry homework assignments), the computer needs to calculate all objects first, to be able to show them on the screen.
When viewing a vector image, it doesn’t matter how much you zoom in – it will never look pixelated. The computer can precisely calculate all the pixels that are needed in order to display the image on your monitor, for every zoom level. This is why a vector graphic is always crisp (unless you intentionally add some blur, of course).
Easy to change
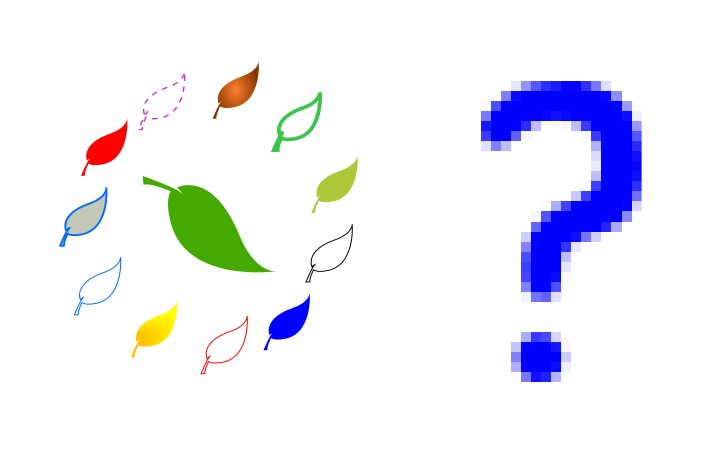
In comparison to raster graphics, it’s very easy to radically change the appearance of a vector graphic by changing only very few of its properties (see image). In a raster graphic, the computer program would need to look at every single dot (or pixel) – and sometimes, it will not be easy for the program to know which dot belongs to which object, because a raster graphic doesn’t actually contain any objects, only a bunch of colorful dots.
Smaller file sizes – more computational work
Vector graphics – as long as they only contain a reasonable number of objects – only need very little disk space, because the color information does not need to be saved for each and every pixel, but only once per object. This is an advantage for images that are meant to be used on web pages, resulting in smaller amounts of data transferred and the web page to load quickly.
On the other hand, it can take longer to prepare highly complex vector images for displaying them on a monitor.
Different types of images for different purposes
Raster and vector graphics are each used for different purposes which complement each other.
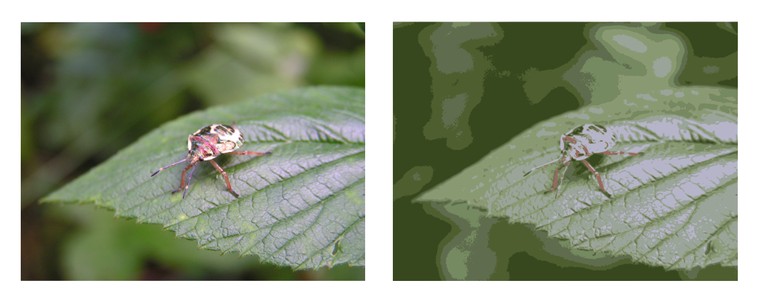
Raster images are used for images with a large amount of irregular, differently colored contents, so mainly for photos. If we wanted to save those in a vector format, trying to render them on a monitor would take very long. Depending upon how much we would then need to simplify the image because of slow rendering, there would also be a lesser amount of different colors in it and the quality would be much worse. In addition to this, at the same level of image quality, the file size would be enourmous, as for each color that appears in the image, a separate object would need to be created (this could be up to 1.9 million objects for a normal 1600x1200 pixel sized photo, if every pixel had a different color).
This is why vector images are most often used for logos, clipart, buttons, icons and other graphics, which are made up of large, coherent single-color areas or can easily be divided into single objects. Of course, depending upon the subject of the drawing, it is also possible to create very realistic looking drawings, which create the impression of 3D depth by skillful use of color gradients.
So, before you jump straight into Inkscape to create the image of your dreams, you should first have a think if Inkscape is the appropriate tool for the task. If your goal is to edit a photo, or to draw a large, realistic image as you would do with a brush on canvas, then there exists other software which is more suitable (e.g. GIMP to edit photos or Krita to draw digital paintings using different brushes. Both of these are – just like Inkscape – open source projects.).
What is SVG?
SVG is a file format for vector graphics. The abbreviation stands for “Scalable Vector Graphics” – resizable images that are made up of vector data. Inkscape uses this file format because it is an open standard, so the files you create with Inkscape can be used universally. Web browsers, e.g. Mozilla Firefox, Google Chrome or Microsoft Edge, but also lots of other programs, support this standard.
This offers the advantage that images you have created in Inkscape are not ‘lost’ when Inkscape is not available. In most cases, those images can, for example, be embedded directly into a web page without needing to do any changes, or other programs (e.g. an office suite, or a desktop publishing program) can open the files, and you can continue to edit them there.
The organisation which sets the SVG standard, is the World Wide Web Consortium (W3C) – that same organisation which also works on the standards for HTML or CSS (the languages used to write and design web pages).
One of the Inkscape developers is a member of the SVG Working Group of the W3C. There, he represents Inkscape and its interests and helps improving the SVG standard even further.
Basic elements
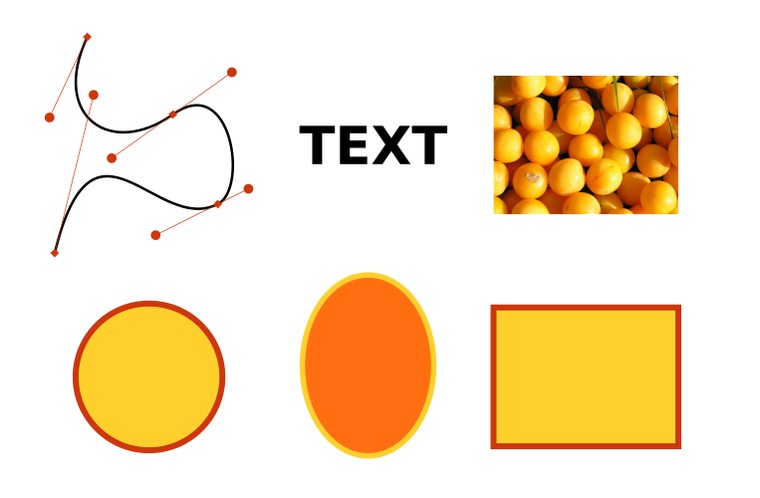
The SVG file format supports a number of basic elements, from which images can be constructed. These are (among others) straight lines, polylines (consisting of multiple straight lines which are connected to each other), paths (composed of one or more curved lines), circles, ellipses, rectangles, polygons, texts, raster graphics (yes, these can also be used inside an SVG!) and copies of other objects (the exact same object is used multiple times in the drawing, but only the original can be edited in a substantial way).
Background info:
Inkscape does not use all available elements – e.g. straight lines or polygons are saved as ‘paths’, too. In exchange for this, Inkscape offers some additional elements, though. For example there are stars and spirals – which are saved in two formats in parallel by Inkscape: first as a normal path (in order to allow for other programs to read them correctly), secondly as a star/spiral with specific properties (length of star tips, number of spiral turns, etc., which makes it possible to change these properties with just a few mouse clicks in Inkscape).
Stacking order
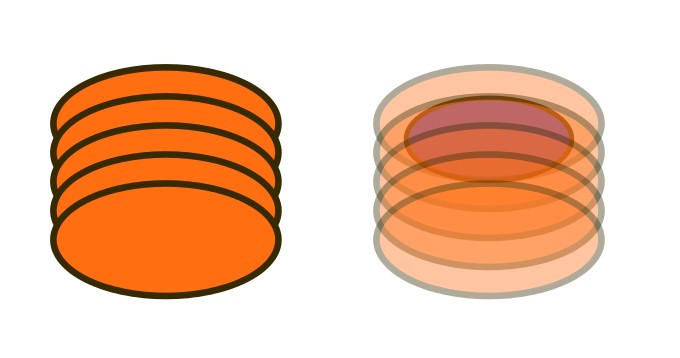
Objects in an SVG image are stacked on top of each other in a specific order – just like in a collage, for example. This is why it is possible that there are objects in your drawing which are completely hidden by another object (see image).
Even if it may look as if two objects are just lying there next to each other, each of them ‘knows’ exactly at which level in the stacking order it is currently. An object can never at the same time be above and below another object (think of a loop in a knot). If you would like to draw something like that, you need to compose the object from multiple parts, which then can be positioned above and below the other object.
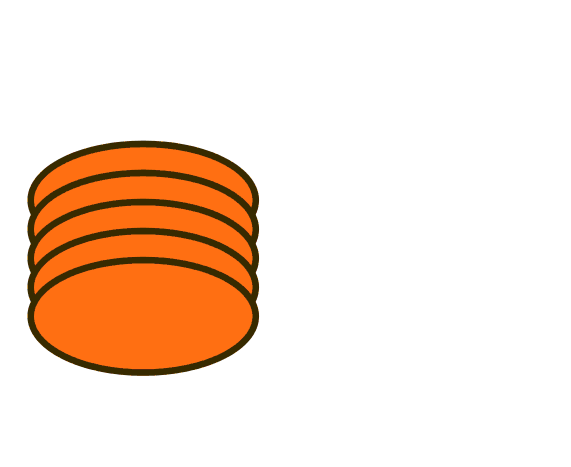
The animation shows how an object that at first was covered by other objects becomes visible when the other objects are moved away, and that the stacking order is preserved even after dragging the objects apart.
Of course, you can change the stacking order in Inkscape. Newly created objects are always placed on top.
Groups
Multiple objects can be combined into a group. This group will now behave like a single object. After grouping, the whole group can easily be moved, the color or stroke width of all contained objects can be changed easily, or the group can just be made smaller, or larger, while, all the time, the relative position of the objects inside the group to each other will stay the same (if you’ve got a drawing of a face, the eyes will always stay in the correct place, no matter if you squash the face, turn it around, stretch it, enlarge it or shrink it).
Plain Text / Tree Structure
And what does an SVG image look like now?
Like this:

Or, in a text editor, the same image will look like this:
<?xml version="1.0" encoding="UTF-8" standalone="no"?>
<svg
  xmlns:dc="http://purl.org/dc/elements/1.1/"
  xmlns:cc="http://creativecommons.org/ns#"
  xmlns:rdf="http://www.w3.org/1999/02/22-rdf-syntax-ns#"
  xmlns:svg="http://www.w3.org/2000/svg"
  xmlns="http://www.w3.org/2000/svg"
  width="220.0025mm"
  height="59.126568mm"
  viewBox="0 0 779.53642 209.50359"
  id="svg7274"
  version="1.1">
  <defs
    id="defs7276" />
  <metadata
    id="metadata7279">
    <rdf:RDF>
      <cc:Work
        rdf:about="">
        <dc:format>image/svg+xml</dc:format>
        <dc:type
          rdf:resource="http://purl.org/dc/dcmitype/StillImage" />
        <dc:title></dc:title>
      </cc:Work>
    </rdf:RDF>
  </metadata>
  <rect
    y="47.820282"
    x="36.782753"
    height="136.08252"
    width="220.18613"
    id="rect7282"
    style="color:#000000;clip-rule:nonzero;display:inline;overflow:visible;visibility:visible;opacity:1;isolation:auto;mix-blend-mode:normal;color-interpolation:sRGB;color-interpolation-filters:linearRGB;solid-color:#000000;solid-opacity:1;fill:#d13131;fill-opacity:1;fill-rule:nonzero;stroke:none;stroke-width:10.70800018;stroke-linecap:round;stroke-linejoin:miter;stroke-miterlimit:4;stroke-dasharray:none;stroke-dashoffset:0;stroke-opacity:1;marker:none;marker-start:none;marker-mid:none;marker-end:none;color-rendering:auto;image-rendering:auto;shape-rendering:auto;text-rendering:auto;enable-background:accumulate" />
  <path
    id="path7824"
    d="M 317.06647,167.11643 506.16814,91.122301"
    style="color:#000000;clip-rule:nonzero;display:inline;overflow:visible;visibility:visible;opacity:1;isolation:auto;mix-blend-mode:normal;color-interpolation:sRGB;color-interpolation-filters:linearRGB;solid-color:#000000;solid-opacity:1;fill:#d13131;fill-opacity:1;fill-rule:nonzero;stroke:#000000;stroke-width:9.69747734;stroke-linecap:round;stroke-linejoin:miter;stroke-miterlimit:4;stroke-dasharray:none;stroke-dashoffset:0;stroke-opacity:1;marker:none;marker-start:none;marker-mid:none;marker-end:none;color-rendering:auto;image-rendering:auto;shape-rendering:auto;text-rendering:auto;enable-background:accumulate" />
  <text
    transform="matrix(0.93959655,-0.34228399,0.34228399,0.93959655,0,0)"
    id="text7826"
    y="235.93027"
    x="256.07684"
    style="color:#000000;font-style:normal;font-variant:normal;font-weight:normal;font-stretch:normal;font-size:32.60264969px;line-height:124.00000095%;font-family:sans-serif;-inkscape-font-specification:sans-serif;text-indent:0;text-align:start;text-decoration:none;text-decoration-line:none;text-decoration-style:solid;text-decoration-color:#000000;letter-spacing:0px;word-spacing:0px;text-transform:none;direction:ltr;block-progression:tb;writing-mode:lr-tb;baseline-shift:baseline;text-anchor:start;white-space:normal;clip-rule:nonzero;display:inline;overflow:visible;visibility:visible;opacity:1;isolation:auto;mix-blend-mode:normal;color-interpolation:sRGB;color-interpolation-filters:linearRGB;solid-color:#000000;solid-opacity:1;fill:#000000;fill-opacity:1;fill-rule:nonzero;stroke:none;stroke-width:1;stroke-linecap:butt;stroke-linejoin:miter;stroke-miterlimit:4;stroke-dasharray:none;stroke-dashoffset:0;stroke-opacity:1;marker:none;marker-start:none;marker-mid:none;marker-end:none;color-rendering:auto;image-rendering:auto;shape-rendering:auto;text-rendering:auto;enable-background:accumulate"
    xml:space="preserve"><tspan
      y="235.93027"
      x="256.07684"
      id="tspan7828">Hallo Welt!</tspan></text>
  <g
    transform="matrix(0.64174981,0,0,0.64174981,211.54347,86.739227)"
    id="g4224">
    <path
      style="color:#000000;clip-rule:nonzero;display:inline;overflow:visible;visibility:visible;opacity:1;isolation:auto;mix-blend-mode:normal;color-interpolation:sRGB;color-interpolation-filters:linearRGB;solid-color:#000000;solid-opacity:1;fill:#ffffff;fill-opacity:1;fill-rule:nonzero;stroke:#ffe42f;stroke-width:20;stroke-linecap:round;stroke-linejoin:miter;stroke-miterlimit:4;stroke-dasharray:none;stroke-dashoffset:0;stroke-opacity:1;marker:none;marker-start:none;marker-mid:none;marker-end:none;color-rendering:auto;image-rendering:auto;shape-rendering:auto;text-rendering:auto;enable-background:accumulate"
      d="M 720.23039,4.7571883 C 707.23938,-10.857893 694.59512,-12.251889 672.21503,-10.777193 597.44659,-5.8504603 661.31902,117.89378 714.58152,69.719145 730.04101,55.736409 740.15161,20.06241 720.23039,4.7571883 Z"
      id="path3410" />
    <path
      style="color:#000000;clip-rule:nonzero;display:inline;overflow:visible;visibility:visible;opacity:1;isolation:auto;mix-blend-mode:normal;color-interpolation:sRGB;color-interpolation-filters:linearRGB;solid-color:#000000;solid-opacity:1;fill:#ffffff;fill-opacity:1;fill-rule:nonzero;stroke:#ffe42f;stroke-width:20;stroke-linecap:round;stroke-linejoin:miter;stroke-miterlimit:4;stroke-dasharray:none;stroke-dashoffset:0;stroke-opacity:1;marker:none;marker-start:none;marker-mid:none;marker-end:none;color-rendering:auto;image-rendering:auto;shape-rendering:auto;text-rendering:auto;enable-background:accumulate"
      d="m 563.47436,-58.792552 c 9.4302,19.849058 29.95124,31.13 33.89319,50.8397923"
      id="path4212" />
    <path
      style="color:#000000;clip-rule:nonzero;display:inline;overflow:visible;visibility:visible;opacity:1;isolation:auto;mix-blend-mode:normal;color-interpolation:sRGB;color-interpolation-filters:linearRGB;solid-color:#000000;solid-opacity:1;fill:#ffffff;fill-opacity:1;fill-rule:nonzero;stroke:#ffe42f;stroke-width:20;stroke-linecap:round;stroke-linejoin:miter;stroke-miterlimit:4;stroke-dasharray:none;stroke-dashoffset:0;stroke-opacity:1;marker:none;marker-start:none;marker-mid:none;marker-end:none;color-rendering:auto;image-rendering:auto;shape-rendering:auto;text-rendering:auto;enable-background:accumulate"
      d="m 720.23039,-109.63234 c -5.48602,9.719707 -21.95856,46.243017 -24.00768,56.488655"
      id="path4214" />
    <path
      style="color:#000000;clip-rule:nonzero;display:inline;overflow:visible;visibility:visible;opacity:1;isolation:auto;mix-blend-mode:normal;color-interpolation:sRGB;color-interpolation-filters:linearRGB;solid-color:#000000;solid-opacity:1;fill:#ffffff;fill-opacity:1;fill-rule:nonzero;stroke:#ffe42f;stroke-width:20;stroke-linecap:round;stroke-linejoin:miter;stroke-miterlimit:4;stroke-dasharray:none;stroke-dashoffset:0;stroke-opacity:1;marker:none;marker-start:none;marker-mid:none;marker-end:none;color-rendering:auto;image-rendering:auto;shape-rendering:auto;text-rendering:auto;enable-background:accumulate"
      d="M 756.94801,-3.7161103 C 775.83322,-9.689161 788.6287,-22.074924 807.7878,-22.074924"
      id="path4216" />
    <path
      style="color:#000000;clip-rule:nonzero;display:inline;overflow:visible;visibility:visible;opacity:1;isolation:auto;mix-blend-mode:normal;color-interpolation:sRGB;color-interpolation-filters:linearRGB;solid-color:#000000;solid-opacity:1;fill:#ffffff;fill-opacity:1;fill-rule:nonzero;stroke:#ffe42f;stroke-width:20;stroke-linecap:round;stroke-linejoin:miter;stroke-miterlimit:4;stroke-dasharray:none;stroke-dashoffset:0;stroke-opacity:1;marker:none;marker-start:none;marker-mid:none;marker-end:none;color-rendering:auto;image-rendering:auto;shape-rendering:auto;text-rendering:auto;enable-background:accumulate"
      d="m 771.07018,62.658062 c 11.27044,24.205292 33.073,44.666748 46.60314,64.961958"
      id="path4218" />
    <path
      style="color:#000000;clip-rule:nonzero;display:inline;overflow:visible;visibility:visible;opacity:1;isolation:auto;mix-blend-mode:normal;color-interpolation:sRGB;color-interpolation-filters:linearRGB;solid-color:#000000;solid-opacity:1;fill:#ffffff;fill-opacity:1;fill-rule:nonzero;stroke:#ffe42f;stroke-width:20;stroke-linecap:round;stroke-linejoin:miter;stroke-miterlimit:4;stroke-dasharray:none;stroke-dashoffset:0;stroke-opacity:1;marker:none;marker-start:none;marker-mid:none;marker-end:none;color-rendering:auto;image-rendering:auto;shape-rendering:auto;text-rendering:auto;enable-background:accumulate"
      d="M 617.13859,73.955794 C 596.85355,85.070623 582.34024,102.84463 559.23771,112.08564"
      id="path4220" />
    <path
      style="color:#000000;clip-rule:nonzero;display:inline;overflow:visible;visibility:visible;opacity:1;isolation:auto;mix-blend-mode:normal;color-interpolation:sRGB;color-interpolation-filters:linearRGB;solid-color:#000000;solid-opacity:1;fill:#ffffff;fill-opacity:1;fill-rule:nonzero;stroke:#ffe42f;stroke-width:20;stroke-linecap:round;stroke-linejoin:miter;stroke-miterlimit:4;stroke-dasharray:none;stroke-dashoffset:0;stroke-opacity:1;marker:none;marker-start:none;marker-mid:none;marker-end:none;color-rendering:auto;image-rendering:auto;shape-rendering:auto;text-rendering:auto;enable-background:accumulate"
      d="m 691.98606,105.02456 c 2.80461,20.11334 0,40.30074 0,60.7253"
      id="path4222" />
  </g>
</svg>
Everyone who ever looked at the source code of a web page will probably recognize the structure of the file – the reason for the likeness being that both kinds of files, HTML and SVG, are based on XML. This is a markup language, that has a tree-like structure (elements nested inside each other) and where each element starts with <something> and ends with </something> – or it may also just look like <something and-a-long-list-of-properties />, when it doesn’t have any further contents, but only properties.
The advantage of this kind of formatting is that it can be read reasonably well by both a computer and a human (as the SVG ‘language’ uses English names, one should be able to read English, though). It can easily be edited automatically by different kinds of programs. This allows, for example, to quickly exchange names in visitor passes, or numbers in admission tickets which you want to print. There exist a host of small helper programs which can support you in such a task.
It’s also possible to unproblematically make little changes by hand to such a file, for example, to prepare it for making animations from it.
Still, most people will probably prefer to edit their drawings using the mouse or a graphics tablet, so they can see right away how their picture changes – and that’s what you can use Inkscape for ;)
Examples
To give you a small impression of what kind of images are possible with Inkscape, below, there’s a set of examples for you. If you are curious to see more of these, you should absolutely visit the gallery with drawings made by Inkscape users at the Inkscape website and also browse a little in the Openclipart Library. Especially the latter offers a wonderful opportunity to learn from other users, by downloading the images and ‘dissecting’ them in Inkscape, to find out how to create specific effects.
Simple Objects

Buttons and Icons with Color Gradients

Complex Drawings with mostly natural-looking Shading

Vectorized Drawings which can now be resized indefinitely

Animations
Applications such as sozi, Inkscape extensions like JessyInk or different JavaScript libraries allow to create animations or presentations, which can be viewed using a web browser. The markup languages CSS and SMIL can also be used to animate SVG images. An introduction into this topic can be found at the Inkscape website.
A few test examples without any deeper meaning:
- Title animation of this website
- Trip around the world
- Appendicitis (left-click to go forward, right-click to go backwards)
Plotters, Cutters and Co
There are many people who do not use Inkscape to create nice graphics, but to mill, automatically cut, paint etc. physical objects. For example, you could use Inkscape (with an Inkscape extension) to control film cutting appliances or to burn decorations into wood using a laser. It is also a great tool to use for painting eggs ;-)
And can we finally start now?
In this article, we have laid the foundations for understanding vector graphics. These will help you to not become confused by the differences in relation to the familiar raster graphics / photo editing when you are working with Inkscape.
As a next step, you should install Inkscape on your computer. The current version for Windows and Mac OS can freely be downloaded from the Inkscape website. For Linux distributions, the website offers the source code, and there is a ppa for Ubuntu and its derivatives at launchpad. Those who do not want to compile themselves on Linux and don’t want or can’t use the ppa, can use the package their distro offers or a distribution-independent format, like AppImage, Snap or Flatpak.
Note:
If you experience problems during installation, you should first read the instructions on the download page slowly again. If this doesn’t help, and a web search also doesn’t return any useful information, you can ask for help in the Inkscape forum or in the Chat.
After you have finished the installation, we will hopefully meet again for Part II: Practice!
This work is licensed under the Creative Commons Attribution-ShareAlike 4.0 License. You may share and adapt the contents, as long as you publish the result under the same license and give appropriate credit.
![]() If you like to use Inkscape and want to support program development, consider to become an active member of the Inkscape community or to make a donation. Your effort will help make Inkscape even more awesome!
If you like to use Inkscape and want to support program development, consider to become an active member of the Inkscape community or to make a donation. Your effort will help make Inkscape even more awesome!

3 Comments ⚓
brynn ⚓
Wed 02 March 2016Very nice!
And well-needed by the community. I expect I’ll be linking to it often :-)
Spencer Capier ⚓
Fri 09 September 2022Thank you for this amazing resource! I downloaded the “Inkscape for Noobs” file but the text is all doubled or like looking at it with double vision. Is there a quick fix or is it because there is a newer version of Inkscape and the file is older? Again thank you for this very well written intro to Inkscape.
Regards,
Spencer C
Moini ⚓
Sat 10 September 2022Hi Spencer,
thank you very much for letting me know about this, it’s fixed now.
Long version: At some point, the layer with the original text that has not been converted to paths has become unhidden, i.e. visible. As you do not have those fonts installed on your computer, you get to see the text in different fonts than those I used.
Another layer contains the same text, but converted to paths, so one would not need to have the fonts installed to see it as it’s supposed to look. That layer is meant to be visible, and it is visible for you, too, resulting in the same text with different fonts overlayed, and giving you the double vision
You can either re-download the file now, or just hide (hover over the name, click on the eye icon) the layer that is called ‘Original text (hidden)’ in the layers dialog.
Kind Regards, Maren